IMAGES FOR THE JEFF RENSE PROGRAM
THE RADIO SKY
If our eyes were capable of seeing radio waves, the image above is what you would see while sky gazing.
It was made by combining data from many radio telescopes all around the planet.
The different colors denote different frequencies.
If we could see up into the infrared, the night sky would look pretty bright.
If we were to "map" the visible light part, deep Red to Violet onto the Radio spectrum,
that is what you would see.
So, let's pretend we can see the radio spectrum.
Looking around a city, you'll see a variety of transmitting antennas in living color.
The tall towers are mainly AM Broadcast transmitters (around 1 MHz, long wavelength)
that use the entire tower as the antenna, because of the long wavelength.
Some may have other types of small antennas attached.
The entire tower would glow a deep red color, like a giant Star Wars light saber.
FM stations (around 100 MHz) also use towers,
though the antennas are small, mounted at the top or side of the tower.
Some radio stations rent out small antenna space on their towers.
The tower itself has no signal, it just gets small antennas up high for the longest range.
They would look orange/yellow.
Cell phone, 5G/6G antennas are at the top of a small poles,
many are disguised as street lights.
They would look green.
Older cell and 3G/4G antennas are larger at the top of a
50 - 100 foot tower (above the ground clutter)
for greater range (height determines the size of the cell).
They would appear yellow/green.
On the older towers, the cables going from the shack to the antennas look thick.
Not because of high power, as these transmitters use about 100 Watts or less.
The reason for thick cables is because all cables waste some of the signal.
The smaller the cable diameter, the more the loss.
This gets worse at microwave frequencies.
The thick cables are simply more efficient,
wasting less of the signal from the transmitter to the antenna.
A common misconception concerns the range of the signals.
All frequencies have the same range in empty space.
The amplitude of a given signal decreases with distance from the source (antenna).
Just like a light bulb, the farther you are from it, the dimmer it appears,
the inverse square law applies.
.
An interesting example are the Voyager deep space probes that use microwaves to communicate.
They are now outside the Solar System, but are still able to communicate with ground stations.
Their signal is extremely weak now.
No one believed this was possible when these probes were launched many decades ago.
Ever increasing distance and lower power output from their aging nuclear "battery"
require a very large Earth receiving dish antenna.
Unfortunately, this won't last much longer.
Power will get too low and increasing distance will leave the signal below the noise floor
(it's called grass) of the receiving antenna, a very big dish.
They'll be on their own, tripping out into the galaxy.
Yes, the range of the higher frequencies used by 5G/6G
compared with the older 3G/4G tech is shorter.
It's not because of the higher frequency.
The older towers are tall enough to be above the ground clutter and have higher power.
The new short 5G/6G antennas are down among the trees and other ground clutter.
Vegetation does absorb and scatter RF signals.
Buildings absorb or reflect signals.
Transmitters are low power, around 20 Watts.
That's why these antennas are springing up every few blocks in the city.
Out in "empty" space, all frequencies have the same range.
For purposes of data transfer, the higher the carrier wave frequency,
the faster the data. That's why 5G/6G internet is faster than the older 3G4G system.
Back to the color analogy.
You'll see similar green color for your Wi-Fi router which has both 2.4 and 5 Ghz antennas inside.
Inside your cell phone are 4 2 way radios (voice calls, Wi-Fi/Data, Bluetooth and NFC)
using tiny antennas etched inside the rear of the phone.
They would also look green when active.
Blue and Violet would be the way up there GHz antennas sprinkled around cities.
Most people never notice these, as they look like a can or small dish attached to various structures.
They are directional, meaning the signal goes in one direction.
There are thousands of these in a typical big city.
To see them on a local map, go to antennasearch.com.
Then, we have so called smart meters and hot spots. The signals from these things are
in the same part of the spectrum as wi-fi and would appear green. They aren't found on antennasearch
because there are millions of smart meters and hot spots. Fortunately, these things are low power.
In a typical city, we are exposed to all these frequencies, like an EM soup.
Walking around outdoors, you would see this mixture as a variety of colors in every direction.
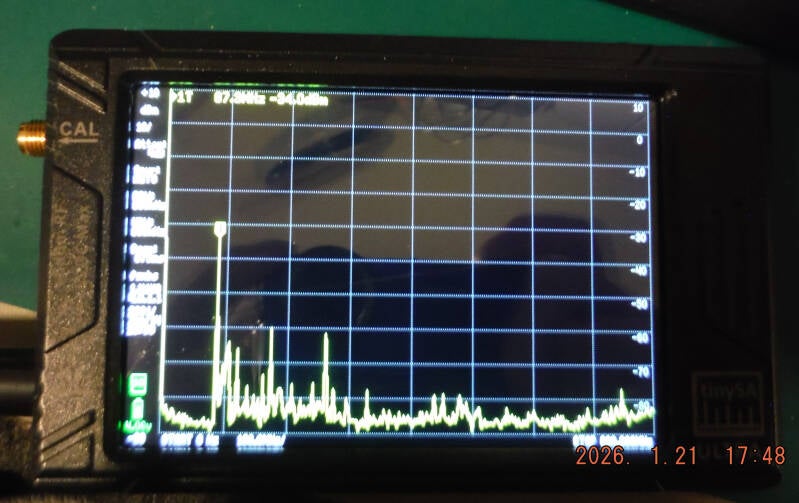
The little gadget above is a handheld spectrum analyzer.
It's called a Tiny SA Ultra and has a frequency range of 100 kHz to 5.3 GHz.
Connected to a small antenna, it shows the spectrum as it exists in my radio room.
The big peak on the left is my micro-power FM-Stereo transmitter at 87.5 MHz.
It's big because it's antenna is only 20 feet away.
To the right shows the signals of local FM stations, the rest of the FM-BCB.
The 3rd signal is from the Denver National Weather Channel at 162.550 MHz.
The FM transmitter signal covers my apartment, this entire building,
the parking lot and about half a block around the building.
I have a decent sounding stereo radio in every room thus making a whole house audio system.
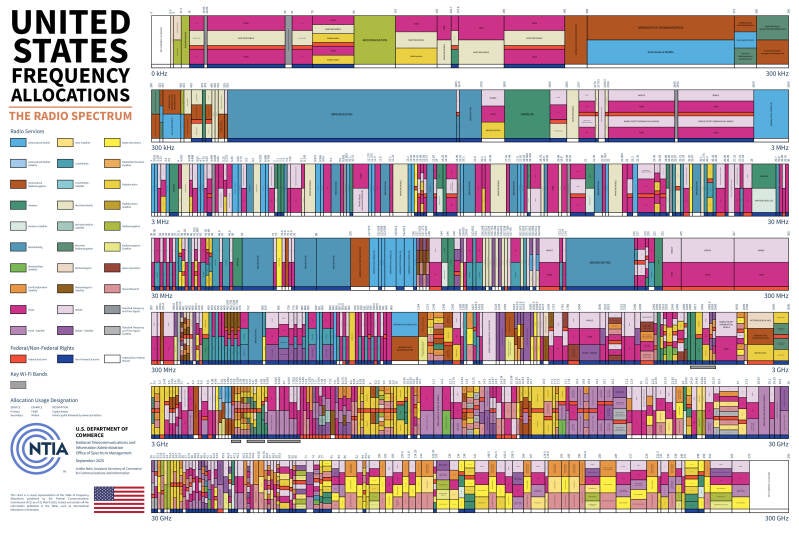
US FREQUENCY ALLOCATIONS RADIO SPECTRUM
The chart above was converted from pdf to jpg and is too small to read.
To see the big colorful pdf map of frequencies from 0 to 300 GHz,
click the link below.
https://www.ntia.gov/sites/default/files/2025-09/ntia-us-frequency-allocations.pdf
If that doesn't work in your browser,
just copy and paste the link above in a new browser tab:
Depending on your computer's video setup,
you may not see the whole thing without some scrolling.
If your browser has a +/- magnifier, try that, mine looks mostly readable at 75%.
Frequency is naturally infinitely variable with no borders.
We humans like to draw lines on maps, which is the case with the Spectrum map.
It's divided up into BANDS designated for various uses, some big and wide, others narrow.
For example: The big blue one is the AM Radio Broadcast Band centered on 1 MHz.
Smaller, higher frequency blue ones are also for broadcast use.
Some bands are channelized, some are not.
All broadcast bands, the CB band, and a few HAM bands are channelized.
A specific frequency = a channel number.
For example, on the CB band, 27.405 MHz = Ch 40.
The following images show the spectrum in several different ways.
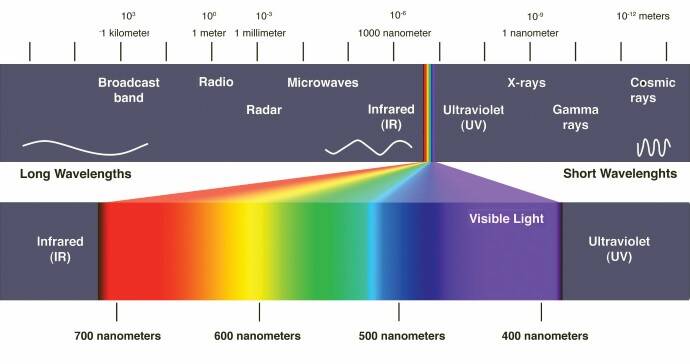
Note the right side of this chart, Cosmic Rays.
More powerful than Gamma, this radiation comes from energetic deep space objects,
many billions of light years away.
So far, no one has detected anything more powerful.
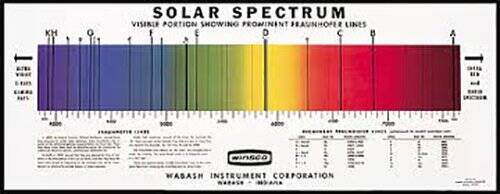
The vertical lines denote various elements in the visible spectrum.
They also extend down into the IR and up in UV.
We have machines that automate this.
Pop in a sample and you get a report showing the elemental composition of the sample.
Astronomers use the emission and absorption lines to
figure out the chemical composition of various planets, gas clouds and other astronomical objects.
Crime labs (CSI) also use these machines to analyze evidence samples.
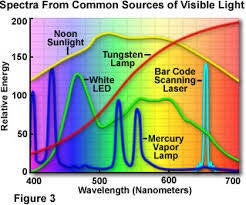
Great graphic that shows the various light sources we have and use daily.
This chart shows the Sun's output over the entire E-M spectrum.
It's backwards of some other charts that have Radio on the left.
Interesting how the Visible part is the highest.
The sun radiates quite a bit of Infrared (IR) energy.
The first LEDs were IR. Remote controls use IR LEDs
The human body radiates IR.
The James Webb space telescope takes it's pictures in IR.
It can see galaxies so far away that their radiation gets red shifted.
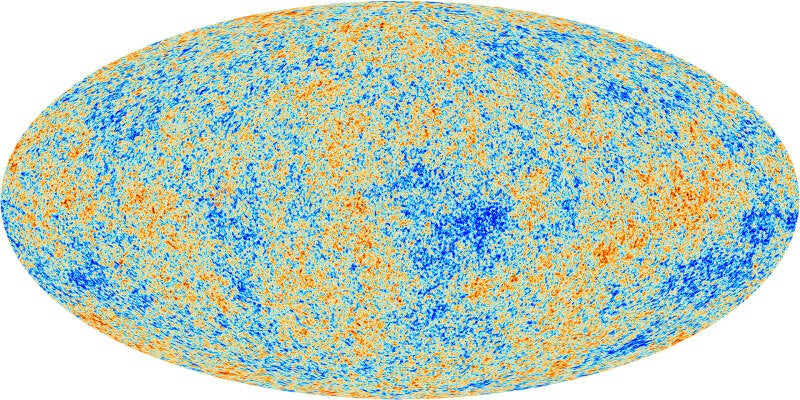
Below is a rendering of the Cosmic Microwave Background Radiation. It has an enormous
amount of energy behind it and comes at us from every direction. It fills all of space!
It was discovered in 1954 and was originally thought to be some form of microwave noise to find and fix.
It started out 13+ Billion years ago at much higher frequencies.
Over time, as the Universe expands, the light gets stretched (red shifted),
it's frequency has shifted much lower to what we see today using ultra-cold detectors.
It is often used in Astrophysics as a proof of the Big Bang.
There are other renderings, this one happens to be my favorite.
Long ago, in the 1800s and before, people received very little exposure to most forms of radiation. There was Ol'Sol, sending infrared, visible light and UV. Yep, the Sun emits energy over the entire EM Spectrum, just most of it is in those frequency ranges. Every now and then, the Sun throws a tantrum, spewing out a crazy amount of radiation at frequencies where it's usually quiet.
Depending on where you are, the Earth emits some radiation, mainly X and Gamma rays from deposits of uranium and other radioactive elements in the soil. The radiation from deep deposits is mostly absorbed by the rock above it.
Most people have heard about Radon.
It's a radioactive element, decay product from Radium, in gas phase.
The stuff wafts it's way up through the soil, seeping into basements.
It winds up contaminating the rest of the house.
When Radon atoms decay, they emit Gamma rays causing
chronic health problems for constantly exposed residents.
Here in Colorado, it's a real problem. Denver is offering free home test kits.
Then there is the Schumann Resonance, lots of talk about that. The Earth's heartbeat?
7.83 Hz is an extremely low frequency with hundreds of miles wavelength.
Several atmospheric layers form a resonant waveguide at that frequency.
The energy driving it comes from lightning strikes.
Globally, lightning is randomly sprinkled all over the Earth's atmosphere, 24/7/365.
Using the right equipment, it's generally detectable in flyover country, anytime.
Cities generate a huge amount of Noise in the radio spectrum,
swamping out low level signals like the Schumann Resonance.
Radiation from beyond the Solar System is constantly bombarding our little planet Earth.
It covers the entire EM Spectrum from radio waves to Gamma.
Fortunately for us, the magnetosphere and atmosphere deal with most of it.
This stuff comes from many types of energetic objects, black holes,
neutron stars, fearsome magnetars, supernova, etc.
FARADAY CAGES
There's much talk about Faraday Cages. Yeah, they do resemble a cage, like at the zoo.
They are made from chicken wire or metal fence like materials.
Where the cage meets the concrete, it must be grounded at many
points using big grounding rods driven deep into the ground.
While serving in the Navy,
I worked on developing new aircraft radar systems inside a Farady Cage,
so I'm quite familiar with them.
The smaller the openings in the mesh wire, the higher frequency it works for.
Basically, they absorb and conduct RF to ground, providing a noise and interference
free environment for Research and Development of sensitive electronic systems.
It also works in the opposite direction, stopping any EMR produced inside from getting out.
Faraday Cages are only for RF. they do nothing for higher frequency radiation such as X-Gamma rays.
That takes thick lead shielding!
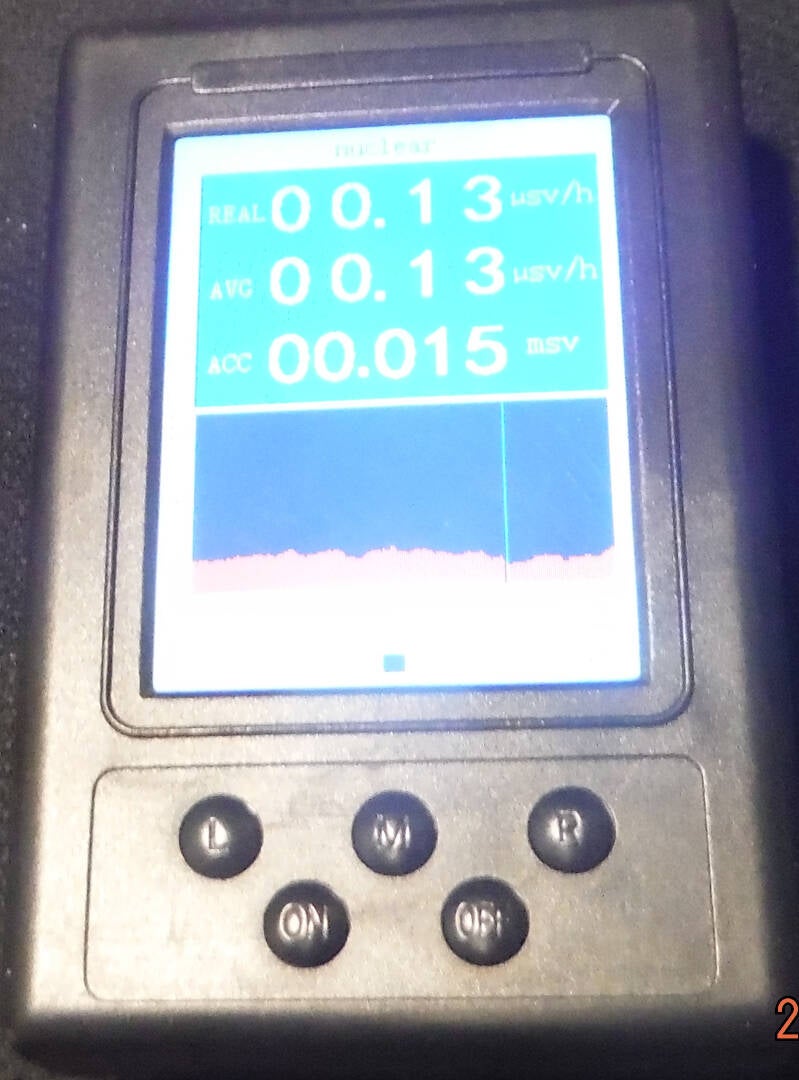
This instrument is a modern Geiger Counter. It detects X and Gamma rays.
The top number is the real instantaneous reading, 13 uSV/H.
That's a low reading, I've seen up to 22 here in Denver.
Middle number is an average over time, 13 uSV/H.
Bottom number is the accumulated dose. Works like a dosimeter.
The longer the meter is on, the larger the number in mSV.
When a Gamma photon goes thru the G-M tube, you hear a click.
Along the bottom is a moving graph (pink) showing the real number.
It's hard to see, pic too bright for the camera.
It proves just how random Gamma is.
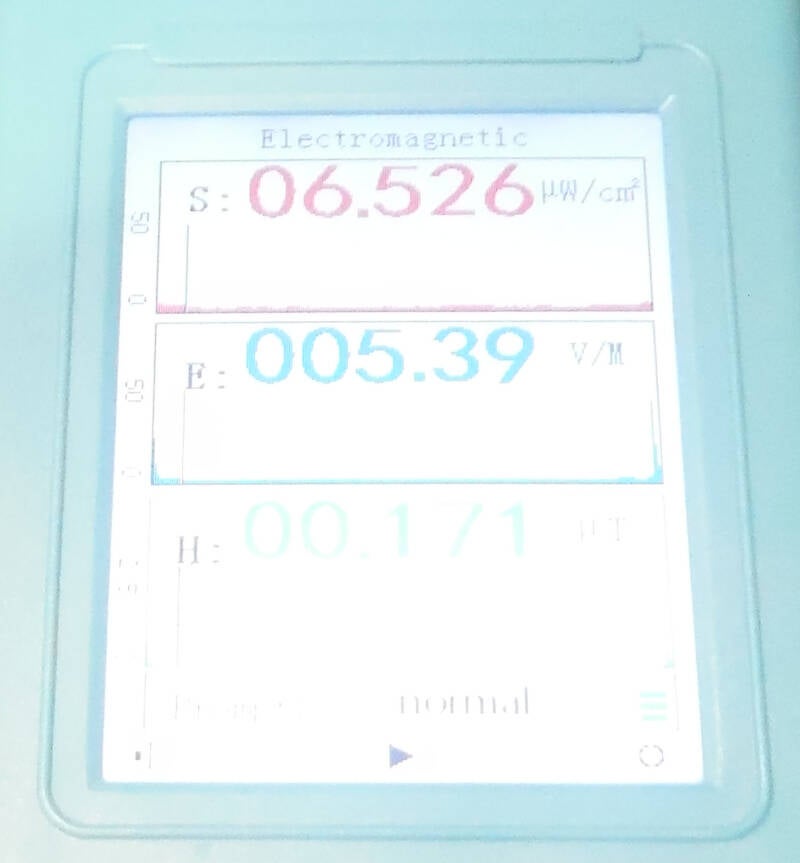
This is a simple EMF meter.
The top number S is for RF field, 6.526 uW/cm2,
E is the electric field 5.39 V/M.
H is the Magnetic field, 5.39 uT.
Move it a few feet and the readings change.
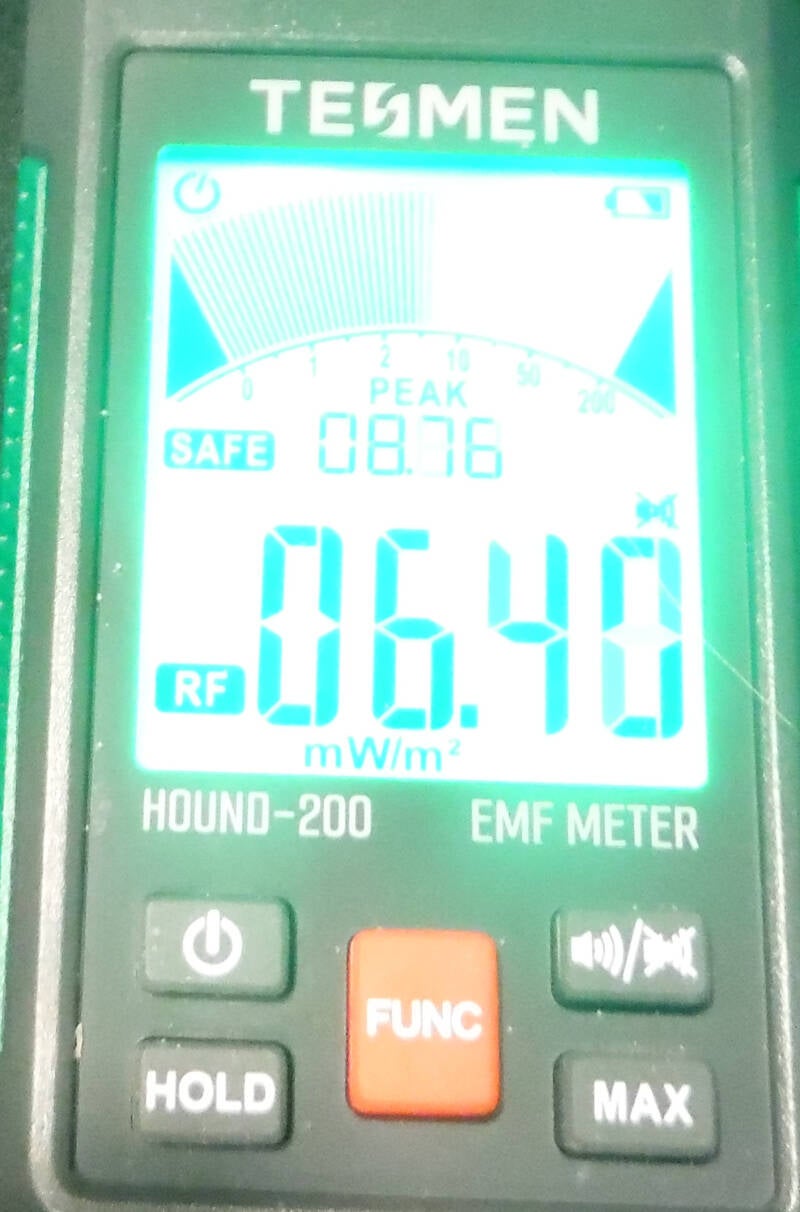
This instrument is a Tesmen EMF meter. It is similar to the EMF meter above.
It uses different units of measurement.
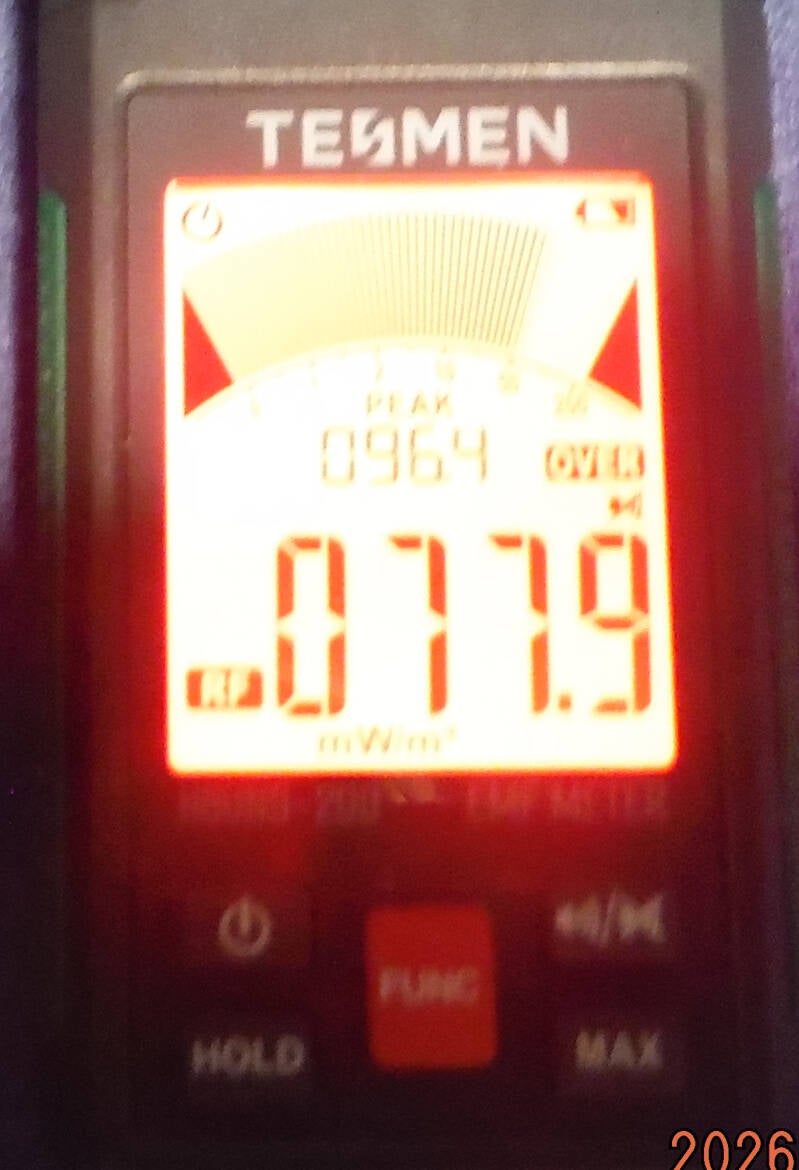
The meter turns orange and then red as you get closer to an RF source.
It is red about 3 feet from the WI-Fi router.